
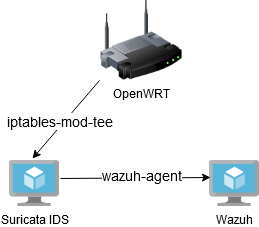
Suricata is a popular intrusion detection system (IDS) that monitors network traffic for suspicious activity. Wazuh XDR (Extended Detection and Response), on the other hand, is a tool that allows you to collect, analyze and correlate data from a variety of sources, such as operating systems, network devices, applications, databases and more. Integrating these two systems running on separate virtual machines makes it possible to create a security monitoring solution. In this article, I'll discuss how to combine Wazuh SIEM with Suricata IDS, running on a separate VM that receives network traffic routed from an OpenWRT router using iptables and the 'TEE' module which is used to clone network packets and forward them to another host or network interface.
I personally use Proxmox as a virtualization management platform to run and manage virtual machines (VMs) and containers (LXCs) on a physical server. With ready-made OVA (Open Virtual Appliance) images, installing Wazuh can be greatly simplified. All we need to do is convert the OVA file to a Proxmox-compatible format.
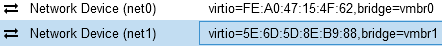
The next step is to configure the VM (Debian) for Suricata IDS with an additional network interface used only to listen for packets forwarded by OpenWRT (iptables-mod-tee). The configurations of the additional network bridge in Proxmox, which behaves like a HUB, are obtained through the parameter 'bridge_ageing 0'
auto vmbr1
iface vmbr1 inet static
        address 172.16.0.2/24
        bridge-ports enp0s25
        bridge-stp off
        bridge-fd 0
        bridge_ageing 0
/etc/network/interfaces
I hook up an additional network interface 'vmbr1' to the VM and run Suricata in a Docker container for easy installation and management.
services:
  suricata:
    image: jasonish/suricata:latest
    container_name: suricata
    cap_add:
      - NET_ADMIN
      - NET_RAW
      - SYS_NICE
    network_mode: "host"
    environment:
      TZ: 'Europe/Warsaw'
    volumes:
      - /opt/suricata/etc:/etc/suricata
      - /opt/suricata/logs:/var/log/suricata
    command: -i ens19
    restart: always
docker-compose.yml
We still need to install the Wazuh agent, which is a lightweight client program that is installed on end systems (servers, desktops, virtual machines, containers, etc.) to monitor, collect data and provide threat protection on our machine where the IDS is running.
The basic configuration of the Wazuh agent like pointing to the 'eve.json' file which is the main log file used by Suricata to record network traffic analysis events and Suricata where we need to point to the appropriate network interface is described here.
The final step is to configure our router, or in this case OpenWRT, to duplicate network packets and forward them to the virtual machine where Suricata is running using the 'TEE' module in iptables.
iptables -t mangle -A POSTROUTING -j TEE --gateway 172.16.0.3OpenWRT iptables traffic mirror
Now we can check if the packets are duplicated correctly on the target machine using 'tcpdump', a tool used to capture and analyze network packets.
kamil@spelunca-deb:~$ curl testmyids.com
uid=0(root) gid=0(root) groups=0(root)
Machine on the local network
root@NIDS:~# tcpdump -i ens19 tcp port http and dst 192.168.1.80 -X
tcpdump: verbose output suppressed, use -v or -vv for full protocol decode
listening on ens19, link-type EN10MB (Ethernet), capture size 262144 bytes
12:46:21.962264 IP 217-160-0-187.elastic-ssl.ui-r.com.http > spelunca-deb.home.arpa.35586: Flags [P.], seq 1:299, ack 78, win 16, options [nop,nop,TS val 2255107924 ecr 101690976], length 298: HTTP: HTTP/1.1 200 OK
        0x0000:  4540 015e 95f4 4000 3906 0e12 d9a0 00bb  E@.^[email protected].......
        0x0010:  c0a8 0150 0050 8b02 8c05 257b 705f 1143  ...P.P....%{p_.C
        0x0020:  8018 0010 6313 0000 0101 080a 866a 3754  ....c........j7T
        0x0030:  060f ae60 4854 5450 2f31 2e31 2032 3030  ...`HTTP/1.1.200
        0x0040:  204f 4b0d 0a43 6f6e 7465 6e74 2d54 7970  .OK..Content-Typ
        0x0050:  653a 2074 6578 742f 6874 6d6c 0d0a 436f  e:.text/html..Co
        0x0060:  6e74 656e 742d 4c65 6e67 7468 3a20 3339  ntent-Length:.39
        0x0070:  0d0a 436f 6e6e 6563 7469 6f6e 3a20 6b65  ..Connection:.ke
        0x0080:  6570 2d61 6c69 7665 0d0a 4b65 6570 2d41  ep-alive..Keep-A
        0x0090:  6c69 7665 3a20 7469 6d65 6f75 743d 3135  live:.timeout=15
        0x00a0:  0d0a 4461 7465 3a20 4d6f 6e2c 2030 3220  ..Date:.Mon,.02.
        0x00b0:  5365 7020 3230 3234 2031 303a 3436 3a32  Sep.2024.10:46:2
        0x00c0:  3120 474d 540d 0a53 6572 7665 723a 2041  1.GMT..Server:.A
        0x00d0:  7061 6368 650d 0a4c 6173 742d 4d6f 6469  pache..Last-Modi
        0x00e0:  6669 6564 3a20 4d6f 6e2c 2031 3520 4a61  fied:.Mon,.15.Ja
        0x00f0:  6e20 3230 3037 2032 333a 3131 3a35 3520  n.2007.23:11:55.
        0x0100:  474d 540d 0a45 5461 673a 2022 3237 2d34  GMT..ETag:."27-4
        0x0110:  3237 3163 3566 3161 6334 6330 220d 0a41  271c5f1ac4c0"..A
        0x0120:  6363 6570 742d 5261 6e67 6573 3a20 6279  ccept-Ranges:.by
        0x0130:  7465 730d 0a0d 0a75 6964 3d30 2872 6f6f  tes....uid=0(roo
        0x0140:  7429 2067 6964 3d30 2872 6f6f 7429 2067  t).gid=0(root).g
        0x0150:  726f 7570 733d 3028 726f 6f74 290a       roups=0(root).
tcpdump -i ens19 tcp port http and dst 192.168.1.80
We can also see the event in Suricat's logs in the 'fast.log' file, which is a log used to record alerts detected by the IDS engine.
root@NIDS:/opt/suricata/logs# tail -f fast.log
09/02/2024-12:41:30.737578  [**] [1:2100498:7] GPL ATTACK_RESPONSE id check returned root [**] [Classification: Potentially Bad Traffic] [Priority: 2] {TCP} 217.160.0.187:80 -> 192.168.1.80:39640
Suricata - fast.log
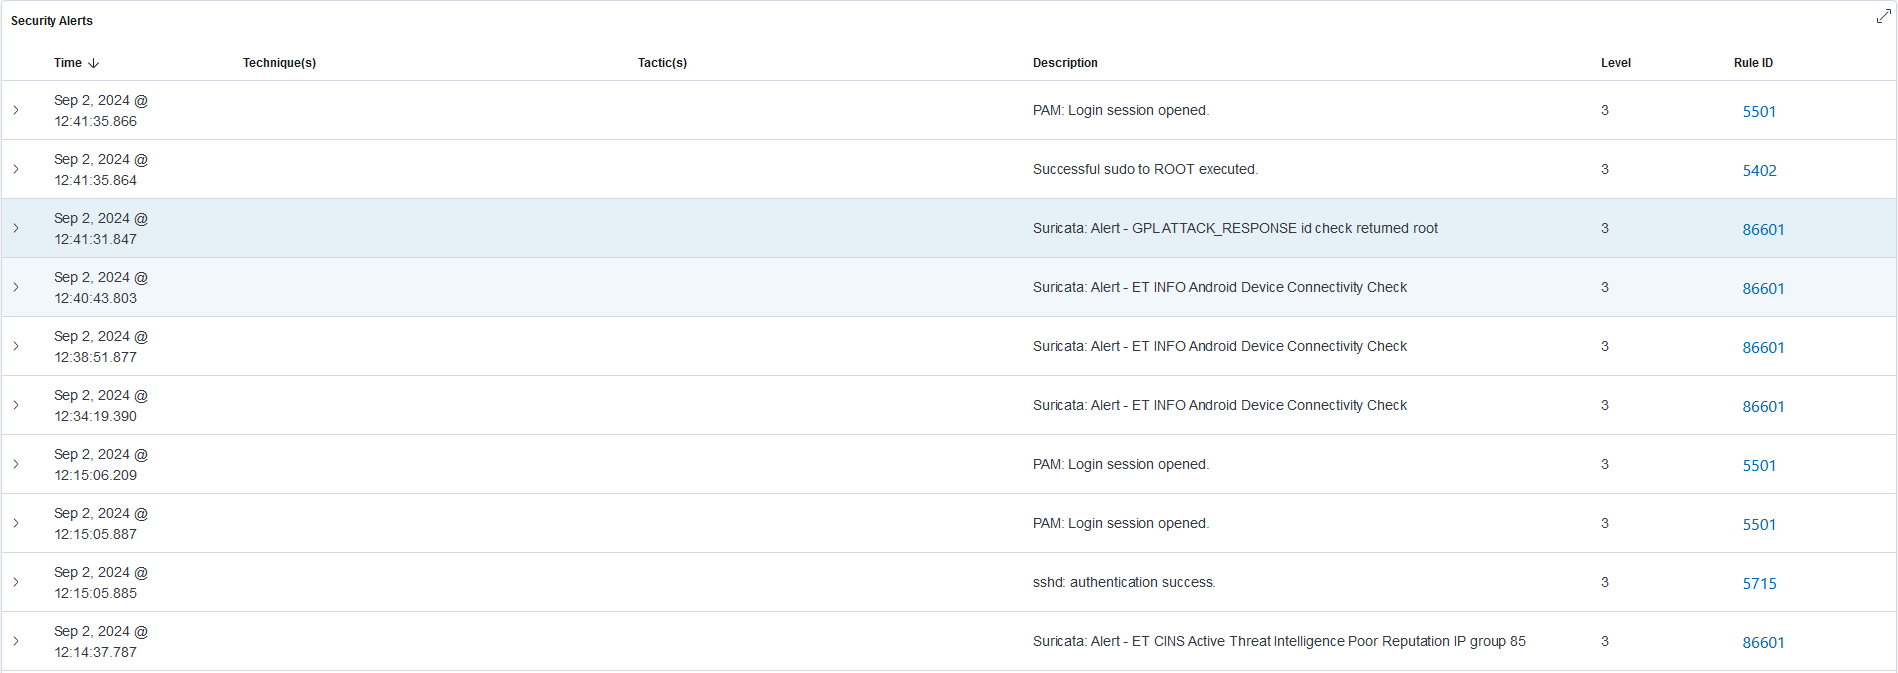
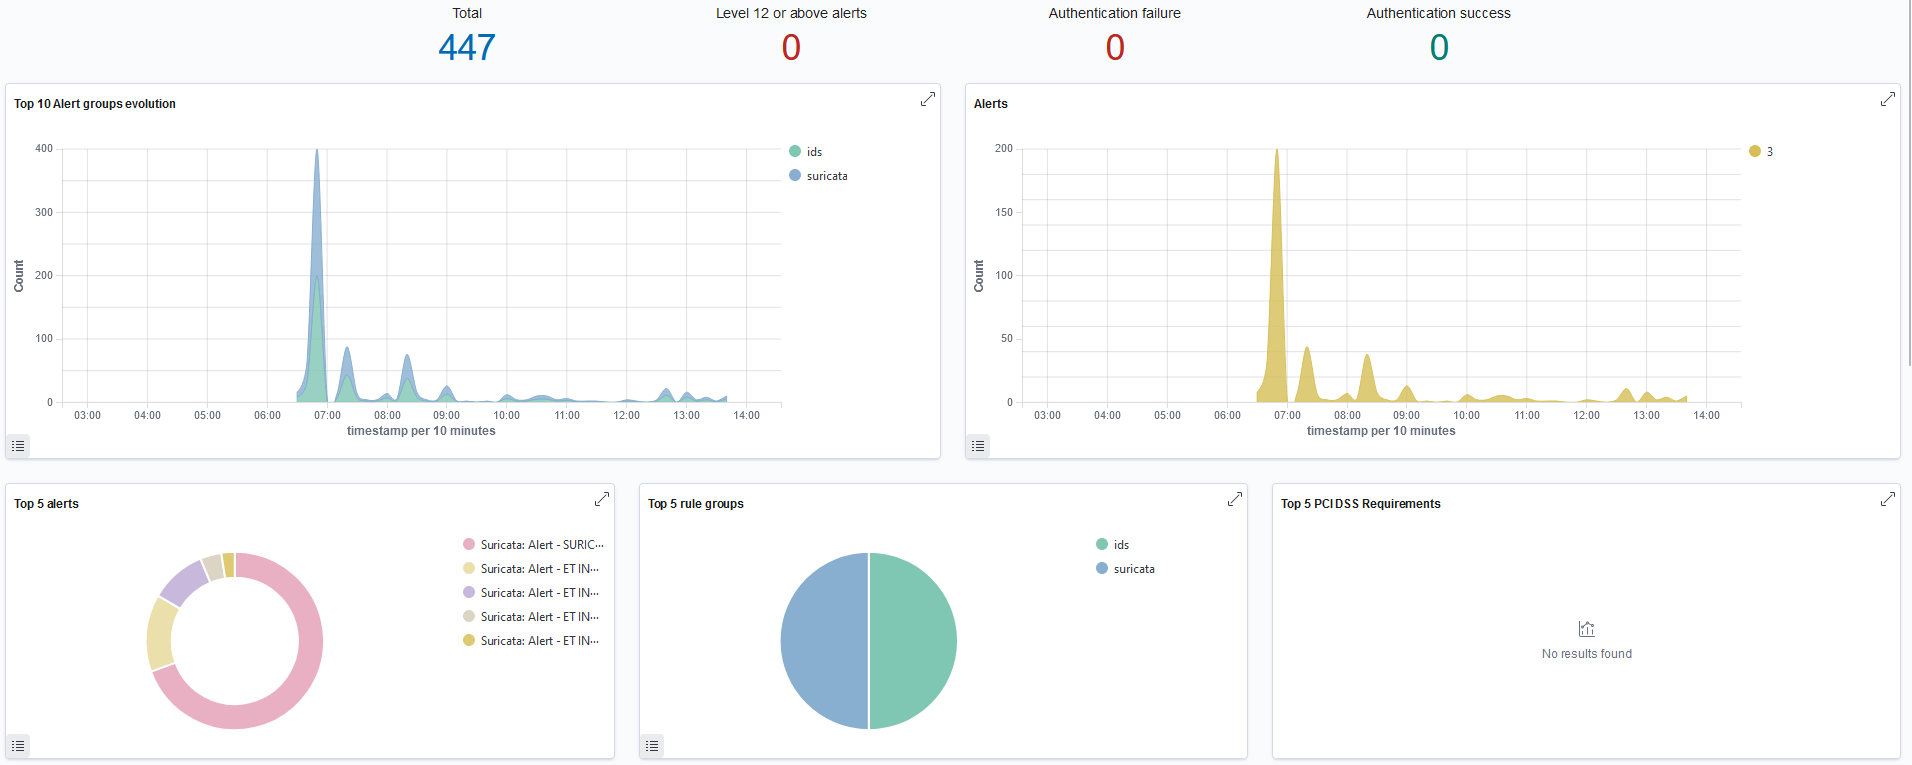
Incidents are also transferred to the user interface in the Wazuh platform for data visualization.
Integrating Suricata IDS with Wazuh brings many benefits, such as centralization of security management, advanced threat analysis, and automation of incident response. By combining these tools, it is possible to consolidate data from different sources, making it easier to identify and correlate incidents, supporting the detection of more complex attacks. Wazuh also enables automated corrective actions, incident notifications and compliance monitoring to help meet audit requirements.
If you do not see any traffic on the network interface that is used to capture packets then the problem may be with traffic routing and the two default gateways - the solution to the problem is here